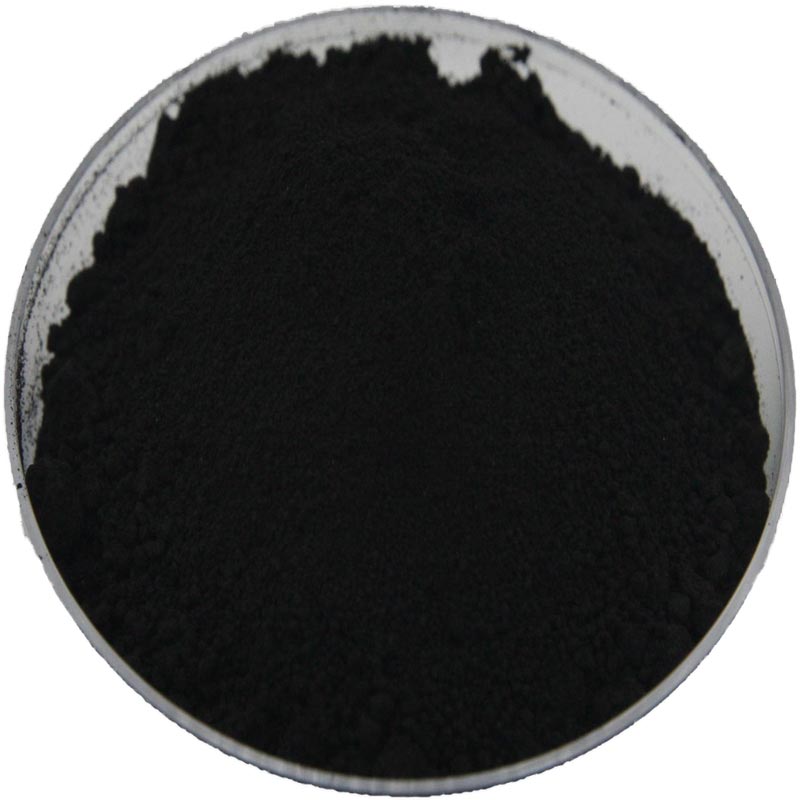
Analysis of China's Iron Oxide Pigment Exports in 2023
China's iron oxide pigment exports showed a significant overall decline in 2023, while the export performance to different trading partners varied markedly. Below is the organized export data along with key conclusions.
I. Overall and Key Trading Partners' Data of China's Iron Oxide Pigment Exports in 2023 (Unit: RMB 100 million)
This table selects the top 5 trading partners by export value in 2023 and compares the data with 2022 to show the growth trend, clearly reflecting the export changes in core markets.

II. Full-Scale Trading Partners' Data of China's Iron Oxide Pigment Exports in 2023 (Unit: RMB)
The following is the list of all trading partners (including countries/regions) of China's iron oxide pigment exports in 2023 and their corresponding export values, sorted in descending order of export value to present the distribution of export markets fully:
| Trading Partner Name | 2023 Export Value (RMB) | Trading Partner Name | 2023 Export Value (RMB) |
|---|---|---|---|
| United States | 401,558,922 | Bolivia | 915,382 |
| Russia | 158,204,991 | Georgia (Newly Added in 2023) | 890,282 |
| India | 110,858,307 | Cameroon | 777,876 |
| Vietnam | 90,125,792 | Mali | 760,767 |
| South Africa | 82,912,489 | Angola | 757,160 |
| Indonesia | 80,634,193 | Somalia | 731,118 |
| Australia | 74,160,171 | Syria | 725,958 |
| Belgium | 63,974,116 | Yemen | 698,757 |
| South Korea | 56,703,746 | Burkina Faso | 674,111 |
| Mexico | 53,165,351 | Tajikistan | 581,563 |
| Turkey | 48,395,481 | Albania | 581,489 |
| United Kingdom | 47,824,968 | Rwanda | 550,430 |
| Spain | 44,431,145 | Belarus | 515,207 |
| Japan | 39,498,736 | Nepal | 478,440 |
| Pakistan | 38,117,235 | Zambia | 476,442 |
| Thailand | 37,984,148 | Paraguay | 475,477 |
| Italy | 35,997,600 | Namibia | 457,610 |
| Malaysia | 35,370,236 | Honduras | 449,266 |
| United Arab Emirates | 33,103,639 | Mauritius | 439,041 |
| Nigeria | 29,513,085 | Nicaragua | 400,514 |
| Netherlands | 28,971,848 | Serbia | 332,848 |
| Canada | 27,604,801 | Benin | 314,539 |
| Saudi Arabia | 25,395,723 | Suriname | 265,408 |
| Brazil | 24,763,260 | Botswana | 263,891 |
| Kenya | 24,222,652 | Hungary | 233,404 |
| Germany | 23,954,432 | Cyprus | 212,877 |
| Egypt | 23,076,277 | Panama | 207,395 |
| Philippines | 22,829,154 | Switzerland | 200,929 |
| Bangladesh | 20,333,824 | Palestine | 184,615 |
| France | 17,538,863 | Republic of the Congo | 182,242 |
| Iraq | 17,339,818 | Sweden | 174,945 |
| Algeria | 17,103,015 | Slovenia | 171,690 |
| Laos | 16,268,587 | Puerto Rico | 162,036 |
| Taiwan, China | 14,649,951 | Ukraine | 156,860 |
| Kazakhstan | 14,611,785 | Barbados | 129,296 |
| Poland | 14,605,405 | Reunion | 126,653 |
| Oman | 12,390,120 | Armenia (Newly Added in 2023) | 115,750 |
| Morocco | 11,776,194 | Latvia | 114,700 |
| Colombia | 11,742,839 | Czech Republic | 109,415 |
| Tanzania | 10,277,036 | Turkmenistan | 72,272 |
| Greece | 9,367,771 | Guyana | 61,618 |
| Peru | 9,318,809 | Afghanistan | 40,540 |
| Israel | 9,043,377 | Dominica | 28,884 |
| Iran | 8,986,139 | Haiti | 27,764 |
| Ivory Coast | 7,791,726 | South Sudan | 19,657 |
| Kuwait | 7,659,654 | Gabon | 19,340 |
| Denmark | 7,642,413 | French Polynesia | 18,676 |
| Sri Lanka | 7,336,253 | Gambia | 12,751 |
| New Zealand | 7,332,683 | Togo | 12,119 |
| Ireland | 7,221,343 | Vanuatu | 8,359 |
| Ghana | 6,585,321 | Cayman Islands | 6,892 |
| Argentina | 6,194,122 | Jamaica | 5,713 |
| Mozambique | 6,094,755 | Malawi | 4,808 |
| Senegal | 5,674,629 | Papua New Guinea | 2,642 |
| Romania (Asia) | 5,466,836 | Central African Republic | 2,325 |
| Guatemala | 5,384,229 | Austria | 328 |
| Lithuania | 5,128,558 | Moldova | 108 |
| Chile | 5,104,940 | Malta | 104 |
| Ecuador | 4,847,016 | Mauritania | 89 |
| Qatar | 4,432,163 | Slovakia | 86 |
| Zimbabwe | 4,169,157 | Bosnia and Herzegovina | 83 |
| Jordan | 3,864,176 | Luxembourg | 48 |
| Uzbekistan | 3,452,951 | North Macedonia | 36 |
| Tunisia | 3,389,206 | Country (Region) Unknown | 36 |
| Djibouti | 3,305,596 | - | - |
| Costa Rica | 3,260,237 | - | - |
| Lebanon | 3,057,492 | - | - |
| Singapore | 2,993,102 | - | - |
| Uruguay | 2,803,871 | - | - |
| Trinidad and Tobago | 2,726,968 | - | - |
| El Salvador | 2,661,642 | - | - |
| Myanmar | 2,639,620 | - | - |
| Portugal | 2,539,112 | - | - |
| Uganda | 2,408,740 | - | - |
| Ethiopia | 2,141,523 | - | - |
| Venezuela | 2,073,394 | - | - |
| Bahrain | 2,032,798 | - | - |
| Mongolia | 1,876,733 | - | - |
| Bulgaria | 1,829,046 | - | - |
| Finland | 1,775,195 | - | - |
| Azerbaijan (Newly Added in 2023) | 1,727,119 | - | - |
| Libya | 1,607,768 | - | - |
| Democratic Republic of the Congo | 1,597,164 | - | - |
| Hong Kong, China | 1,594,078 | - | - |
| Kyrgyzstan | 1,382,760 | - | - |
| Estonia | 1,356,115 | - | - |
| North Korea | 1,353,963 | - | - |
| Sudan | 1,165,365 | - | - |
| Guinea | 1,163,989 | - | - |
| Cambodia | 1,076,359 | - | - |
| Norway | 1,034,402 | - | - |
| Dominican Republic | 962,947 | - | - |
| Madagascar | 959,465 | - | - |
| Sierra Leone | 930,976 | - | - |
III. Key Conclusions on China's Iron Oxide Pigment Exports in 2023
Sharp Overall Export Decline: The total export value in 2023 was RMB 2.167 billion, a decrease of 28.03% compared with RMB 3.011 billion in 2022. This reflects the significant impact of factors such as shrinking overseas demand, intensified international competition, or adjustments in domestic supply.
Obvious Differentiation in Major Markets:
Markets with Sharp Declines: Traditional major export destinations like the United States (-52.88%) and Germany (-84.00%) saw significant drops, which may be affected by local economic conditions, trade policies, or competition from alternative products.
Relatively Stable Markets: Russia (-2.40%) and India (-12.69%) had smaller declines than the overall level, showing strong resilience in market demand.
The Only Market with Positive Growth: Vietnam became the only major trading partner to achieve export growth with a 5.88% increase, which may benefit from the rising demand for infrastructure and manufacturing in the region.
Broad Coverage of Export Markets: In 2023, China's iron oxide pigment exports covered more than 100 countries and regions worldwide. In addition to the top five markets, emerging markets such as South Africa, Indonesia, and Australia also accounted for a certain share, demonstrating a clear feature of market diversification.
- Head Office Address: No. 1 of Lane 185, South Anxie Road, Jiading District, Shanghai, China
- WeChat: 18217101261
- WhatsApp: +86 18217101261
- E-mail: pigment@shshenhong.net


